如果您看不到这些图,放大应用程序窗口。
要记录剖析程序的数据,请参阅记录来自剖析程序的数据。
当您按下 P 键,如果超出您设置的阈值,Kanzi 记录通知:
通过 Kanzi 性能剖析系统,您可以测量 Kanzi 应用程序的性能。
您可以在这里找到如何测量您的 Kanzi 应用程序中代码的性能。要测量应用程序启动时 Kanzi Engine 不同部分的性能以及 Kanzi 在主循环中运行的任务性能,在 Profiling build 中使用性能剖析程序。请参阅测量 Kanzi Engine 的性能。
要测量应用程序节点的性能,您可以:
要为函数和范围的性能测量分组,创建您自己的性能剖析类别。
要创建性能剖析类别,使用 kzProfilingCreateCategory 宏定义类别,使用 kzProfilingRegisterCategory 宏注册该类别。
例如:
//定义性能剖析类别 MY_PROFILING_CATEGORY。
//将该类别的编译时状态设置为启用,命名该类别 MyProfilingCategory,
//并将该类别的样本缓冲区大小设置为 200。
#define MY_PROFILING_CATEGORY kzProfilingCreateCategory(KZ_PROFILING_ENABLED_CATEGORY, "MyProfilingCategory", 200)
//注册性能剖析类别 MY_PROFILING_CATEGORY 并将其初始运行时状态设置为已启用。
//性能剖析类别的运行时状态控制该类别中的剖析程序是否收集样本。
//您可以在应用程序配置中控制性能剖析类别的运行时状态。
请参阅 ProfilingCategoryFilter。
kzProfilingRegisterCategory(MY_PROFILING_CATEGORY, KZ_PROFILING_ENABLED_CATEGORY)
您可以使用您创建的性能剖析类别剖析如下性能:
您可以使用 Kanzi 剖析宏在您的应用程序代码中测量任何范围的执行时间:
kzProfileScope 剖析范围的执行时间。kzProfileScopeExtended 使用自定义剖析程序注册表和样本缓冲区大小剖析范围的执行时间。要测量范围的性能:
KZ_PROFILING_CATEGORY_GENERIC。kzProfileScope 宏。kzProfileScope 宏创建剖析文件并在 Default Profiler Registry 中注册剖析程序。每次输入范围时,Kanzi 向剖析程序添加样本,其中包括执行此范围花费的时间。if (!m_interpolationActive) 块在滚动视图示例中的执行时间: //将插值回放添加到代码中激活插值回放。
if (!m_interpolationActive)
{
//kzProfileScope() 测量执行此范围的时间。
//kzProfileScope() 创建的剖析程序分配到 KZ_PROFILING_CATEGORY_GENERIC 目录并在 Default Profiler Registry 中注册。
//该剖析程序的名称为"Activate interpolation playback"。
//每次输入范围时,即当"!m_interpolationActive"为真时,Kanzi 添加新样本到剖析程序中。
kzProfileScope(KZ_PROFILING_CATEGORY_GENERIC, "Activate interpolation playback");
getDomain()->getRootTimelineClock()->addTimelinePlayback(m_interpolationPlayback);
m_interpolationActive = true;
}Kanzi 将性能测量信息写入日志中。
info:profiling> Generic::Activate interpolation playback:
info:profiling>   Total duration [ns]: 34279
info:profiling>   Number of intervals: 1
info:profiling>   Average duration [ns]: 34279
info:profiling>   Longest duration [ns]: 34279
info:profiling>   Shortest duration [ns]: 34279
您可以使用 kzProfileFunction 宏在您的应用程序中测量任何函数的执行时间:
要测量函数的性能:
KZ_PROFILING_CATEGORY_GENERIC。kzProfileFunction 宏。kzProfileFunction 宏在此函数中创建静态剖析文件并在默认剖析程序注册表中注册剖析程序。每次调用函数时,Kanzi 向剖析程序添加新样本,其中包括执行此函数花费的时间。onScrollViewScrolled() 函数在滚动视图示例中的性能: void onScrollViewScrolled(ScrollView3D::ScrollMessageArguments& messageArguments)
{
//kzProfileFunction() 测量执行 onScrollViewScrolled() 函数的时间。
//kzProfileFunction() 创建的剖析程序分配到 KZ_PROFILING_CATEGORY_GENERIC 目录并在默认剖析程序注册表中注册。
//剖析程序的名称由编译器提供,并包括该函数的名称。请参阅 KZ_PROFILING_THIS_FUNCTION_NAME。
//每次调用 onScrollViewScrolled() 函数时,Kanzi 添加新样本到剖析程序。
kzProfileFunction(KZ_PROFILING_CATEGORY_GENERIC);
...
}Kanzi 将性能测量信息写入日志中。
日志中的 Number of intervals 显示函数被调用的次数。
info:profiling> Generic::void __thiscall ScrollViewApplication::onScrollViewScrolled(class kanzi::ScrollViewConcept::ScrollMessageArguments &):
info:profiling>   Total duration [ns]: 200211
info:profiling>   Number of intervals: 246
info:profiling>   Average duration [ns]: 813
info:profiling>   Longest duration [ns]: 16410
info:profiling>   Shortest duration [ns]: 364
要测量自定义主循环任务的性能:
KZ_PROFILING_CATEGORY_GENERIC。MainLoopTaskProfilerSharedPtr m_onScrollViewScrolledProfiler;
onScrollViewScrolled() 函数的剖析程序,在 scroll_view.cpp 文件中在 onProjectLoaded() 函数中添加://在KZ_PROFILING_CATEGORY_GENERIC类别中创建主循环任务剖析程序。 //将 性能 HUD (Performance HUD) 中的性能图标题设置为 "Main loop: Scroll View scrolled"。 //将剖析程序的样本缓冲区大小设置成KZ_PROFILING_CATEGORY_GENERIC样本缓冲区的相同大小。 m_onScrollViewScrolledProfiler = MainLoopTaskProfiler::create("Main loop: Scroll View scrolled", kzProfilingGetCategoryRuntimeReference(KZ_PROFILING_CATEGORY_GENERIC), kzProfilingGetCategorySampleBufferSize(KZ_PROFILING_CATEGORY_GENERIC)); //在主循环任务注册表中注册剖析程序。 //性能 HUD (Performance HUD) 通过在MainLoopTaskProfilerRegistry中注册的所有剖析程序 //并为剖析类别状态设置为 "shown in HUD" 的剖析程序绘制性能图。 //要访问剖析类别的状态,使用ProfilingCategory::isShownInHUD()函数。 getDomain()->getMainLoopTaskProfilerRegistry().registerProfiler(m_onScrollViewScrolledProfiler);
kzProfileScopeWithSamplerExtended 宏剖析使用采样程序的 onScrollViewScrolled() 函数的执行时间。kzProfileScopeWithSamplerExtended 宏传递在上一步中创建的剖析程序。这样即可在您要剖析的范围之外创建剖析程序。 void onScrollViewScrolled(ScrollView3D::ScrollMessageArguments& messageArguments)
{
//向 kzProfileScopeWithSamplerExtended 宏传递您创建的 m_onScrollViewScrolledProfiler 剖析程序。
// MainLoopTaskProfilingSampler 收集间隔测量数据。
// MainLoopTaskProfilerRegistry::getMainLoopCounter() 函数获得主循环计数器的值。
kzProfileScopeWithSamplerExtended(KZ_PROFILING_CATEGORY_GENERIC,
m_onScrollViewScrolledProfiler,
MainLoopTaskProfilingSampler,
(getDomain()->getMainLoopTaskProfilerRegistry().getMainLoopCounter()));
...
} //为应用程序处理键盘输入。
virtual void onKeyInputEvent(const KzsInputEventKey* inputData) KZ_OVERRIDE
{
KzsInputKey button = kzsInputEventKeyGetButton(inputData);
KzsInputKeyDeviceState state = kzsInputEventKeyGetState(inputData);
if (state == KZS_KEY_DEVICE_STATE_DOWN)
{
switch (button)
{
case KZS_KEY_P:
//定义持续期间阈值。
chrono::nanoseconds threshold(1000);
//记录样本数据。
m_onScrollViewScrolledProfiler->logAllData();
//检查是否超出阈值。
if (m_onScrollViewScrolledProfiler->getProfilingStatistics().m_longestInterval > threshold)
{
//查找在哪次迭代中超出阈值。
for (size_t i = 0; i < m_onScrollViewScrolledProfiler->getSampleCount(); ++i)
{
const MainLoopTaskProfilerSampleData& s = m_onScrollViewScrolledProfiler->getSample(i);
if (s.m_duration > threshold)
{
kzLogDebug(("The threshold was exceeded on main loop iteration {} - the duration was {} ns.", s.m_mainLoopCounter, static_cast<uint64_t>(s.m_duration.count())));
}
}
}
...
}
}
}
# 显示完整的 性能 HUD (Performance HUD)。
PerformanceInfoLevel = 2
# 为 KZ_PROFILING_CATEGORY_GENERIC 类别的性能剖析程序显示性能剖析图。
ProfilingCategoryFilter="Generic=show"
performance_info.hpp 头文件。#include <kanzi/core.ui/application/performance_info.hpp>
onProjectLoaded 函数中添加://获取 performanceInfo 对象。如果对象不存在,请创建。 PerformanceInfo& performanceInfo = acquirePerformanceInfo(); //将图形框的颜色设置为灰色。 performanceInfo.setBorderColor(ColorRGBA(0.5f, 0.5f, 0.5f)); //将图形数据的颜色设置为黄色。 performanceInfo.setLineColor(ColorRGBA(1.0f, 1.0f, 0.0f)); //将文本的颜色设置为黑色。 performanceInfo.setFontColor(ColorRGBA(0.0f, 0.0f, 0.0f));
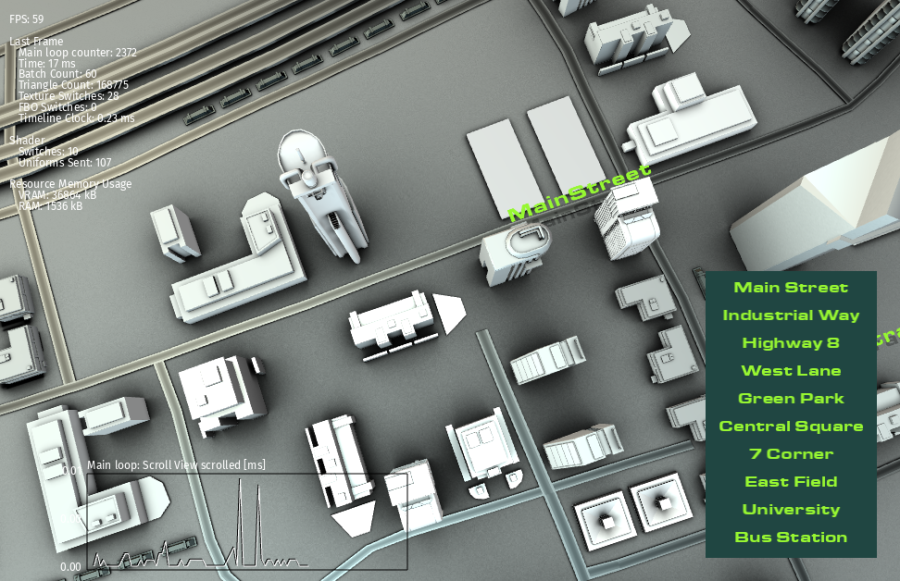
当您运行应用程序时,性能 HUD (Performance HUD) 在应用程序屏幕左下角显示您创建的性能剖析程序的性能剖析图。
如果您看不到这些图,放大应用程序窗口。
要记录剖析程序的数据,请参阅记录来自剖析程序的数据。
当您按下 P 键,如果超出您设置的阈值,Kanzi 记录通知:
info:debug> The threshold was exceeded on main loop iteration 2 - the duration was 4376 ns.
要分析您的应用程序代码性能,记录性能剖析数据。您可以记录来自您创建的剖析程序和剖析程序注册表的每个样本的数据和摘要数据。
您可以记录来自您创建的剖析程序的数据。请参阅测量自定义主循环任务的性能。
要记录来自剖析程序的数据:
logAllData() 函数。m_onScrollViewScrolledProfiler 剖析程序的所有数据,使用getDomain()->getMainLoopTaskProfilerRegistry().m_onScrollViewScrolledProfiler->logAllData();
要记录来自剖析程序的数据摘要,使用 logAggregateData() 函数。
例如,要记录来自 m_onScrollViewScrolledProfiler 剖析程序的数据摘要,使用
getDomain()->getMainLoopTaskProfilerRegistry().m_onScrollViewScrolledProfiler->logAggregateData();
您可以通过在剖析程序中迭代并调用 logAggregateData() 或 logAllData() 函数来记录特定剖析程序注册表中注册的所有剖析程序的数据。
例如,要在退出应用程序时记录来自 Default Profiler Registry 中注册的所有剖析程序的性能剖析数据摘要,包括函数和范围剖析程序:
    //Kanzi 在应用程序退出时调用函数。
    virtual void onShutdown() KZ_OVERRIDE
    {
        //获得 Default Profiler Registry DefaultProfilerRegistry,剖析系统在此注册函数和范围剖析程序。
        AbstractProfilerRegistry& registry = kzProfilingGetDefaultRegistry();

        //通过 Default Profiler Registry 中的所有剖析程序,并记录其数据摘要。
        for (AbstractProfilerRegistry::ProfilerContainer::const_iterator
            profilerIter = registry.beginProfilers(),
            profilerIterEnd = registry.endProfilers();
            profilerIter != profilerIterEnd; ++profilerIter)
        {
            (*profilerIter)->logAggregateData();
        }
    }
